


All the component companies are trying to keep pace with the ever-changing landscape of the software world. Thanks to the popular Apple iPhone, the latest culture craze is the mobile phone. Google and Microsoft have both entered the market with competition to the iPhone.
Microsoft's latest phone, the Windows Phone (what else would Microsoft call it?) is a contender. Component companies are scrambling to get components created for this new platform. Since the Windows Phone supports Silverlight and several companies have already written components for WPF and Silverlight, it's a no brainer to crank them out for the WP7 phone. One such company, Visifire, has returned with a powerful response unveiling a charting library that works seamlessly for the Windows Phone.
Installation and Documentation
There is no real installation per se for this library. This is fine because all we want to do is copy the library, add it as a reference to my project, and create my application. The download comes complete with a set of samples. The download does not seem to have any documentation, but these days all documentation is online and we easily found what we needed on Visifire's website. When we look for a component for a project these are the two questions we ask ourself: 1) How thorough is the documentation for using the product? and 2) How quickly can we get answers that are not in the documentation? Visifire's site has online documentation, plenty of examples showing how to use the charts, and an active forum for answering questions.
Visifire's Sample
Although the samples were only written for WPF, able to copy a WPF sample into my Windows Phone project and use the code to create the same chart in Silverlight. As with any WPF app, you can create the control in dynamically in code or in XAML. The sample creates the chart completely in C# code. Below is the code for creating a simple bar chart with random heights; as you can see it is very straightforward. This is exactly how we would expect to populate a chart - minimal code, easy to understand. You can see the sample is amply commented, but you barely need the comments to understand how to create a bar chart:
Listing 1 - Creating a Visifire Chart Dynamically
public void CreateChart() { // Create a new instance of Chart Chart chart = new Chart(); // Create a new instance of Title Title title = new Title(); // Set title property title.Text = "Visifire Sample Chart"; // Add title to Titles collection chart.Titles.Add(title); // Create a new instance of DataSeries DataSeries dataSeries = new DataSeries(); // Set DataSeries property dataSeries.RenderAs = RenderAs.Column; // Create a DataPoint DataPoint dataPoint; for (int i = 0; i < 10; i++) { // Create a new instance of DataPoint dataPoint = new DataPoint(); // Set YValue for a DataPoint dataPoint.YValue = rand.Next(-100, 100); // Add dataPoint to DataPoints collection. dataSeries.DataPoints.Add(dataPoint); } // Add dataSeries to Series collection. chart.Series.Add(dataSeries); // Add chart to LayoutRoot ContentPanel.Children.Add(chart); } |
Initially creating the charts in XAML so have some control over them in Blend. Curious to see how this worked with Visifire, so went to their website and copied the following XAML. You can actually go to Visifire's website and they have this cool little chart designer in which you can generate extract the XAML for your own purposes:
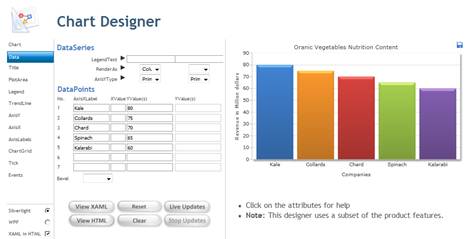
Figure 1 - Using Visifire's Online Chart Designer
The online tool generator allowed me to quickly design a bar chart and the results are shown in Listing 2:
Listing 2 - XAML Generated by Online Tool for Creating Charts
<vc:Chart xmlns:vc="clr-namespace:Visifire.Charts;assembly=SLVisifire.Charts" Width="500" Height="300" BorderThickness="0" Theme="Theme1"ToolBarEnabled="True" >
<vc:Chart.Titles>
<vc:Title Text="Organic Vegetables Nutrition Content" Enabled="True" />
</vc:Chart.Titles>
<vc:Chart.AxesX>
<vc:Axis Title="Greens" />
</vc:Chart.AxesX>
<vc:Chart.AxesY>
<vc:Axis Title="Nutritional Rating" AxisType="Primary" />
</vc:Chart.AxesY>
<vc:Chart.Series>
<vc:DataSeries RenderAs="Column" AxisYType="Primary" >
<vc:DataSeries.DataPoints>
<vc:DataPoint AxisXLabel="Kale" YValue="80" />
<vc:DataPoint AxisXLabel="Collards" YValue="75" />
<vc:DataPoint AxisXLabel="Chard" YValue="70" />
<vc:DataPoint AxisXLabel="Spinach" YValue="65" />
<vc:DataPoint AxisXLabel="Kalarabi" YValue="60" />
</vc:DataSeries.DataPoints>
</vc:DataSeries>
</vc:Chart.Series>
</vc:Chart>
Curious to plug the XAML into my Windows Phone and check the results against what the online tool produced. Figure 2 shows the results of placing the XAML in Listing 2 inside the MainPage of the Windows Phone App, pretty much what you see in the online designer. It cut off a little bit of the chart, so brought it up in Blend to see if could adjust it:
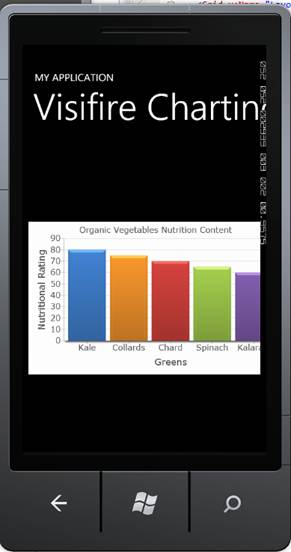
Figure 2 - Organic Vegetable Bar Chart using Visifire's online designer on WP7


0 comments:
Post a Comment